February 2025 Workshop Summary: Multispecies Indicators
February’s session began with discussions on a method for producing multispecies biodiversity indicators (Freeman et al, 2021), led by Mike Dunbar (Environment Agency). Mike’s interest in multispecies indicators was prompted by demand for a single indicator to capture temporal changes in multiple environmental chemicals in his work.
Some ideas from the paper
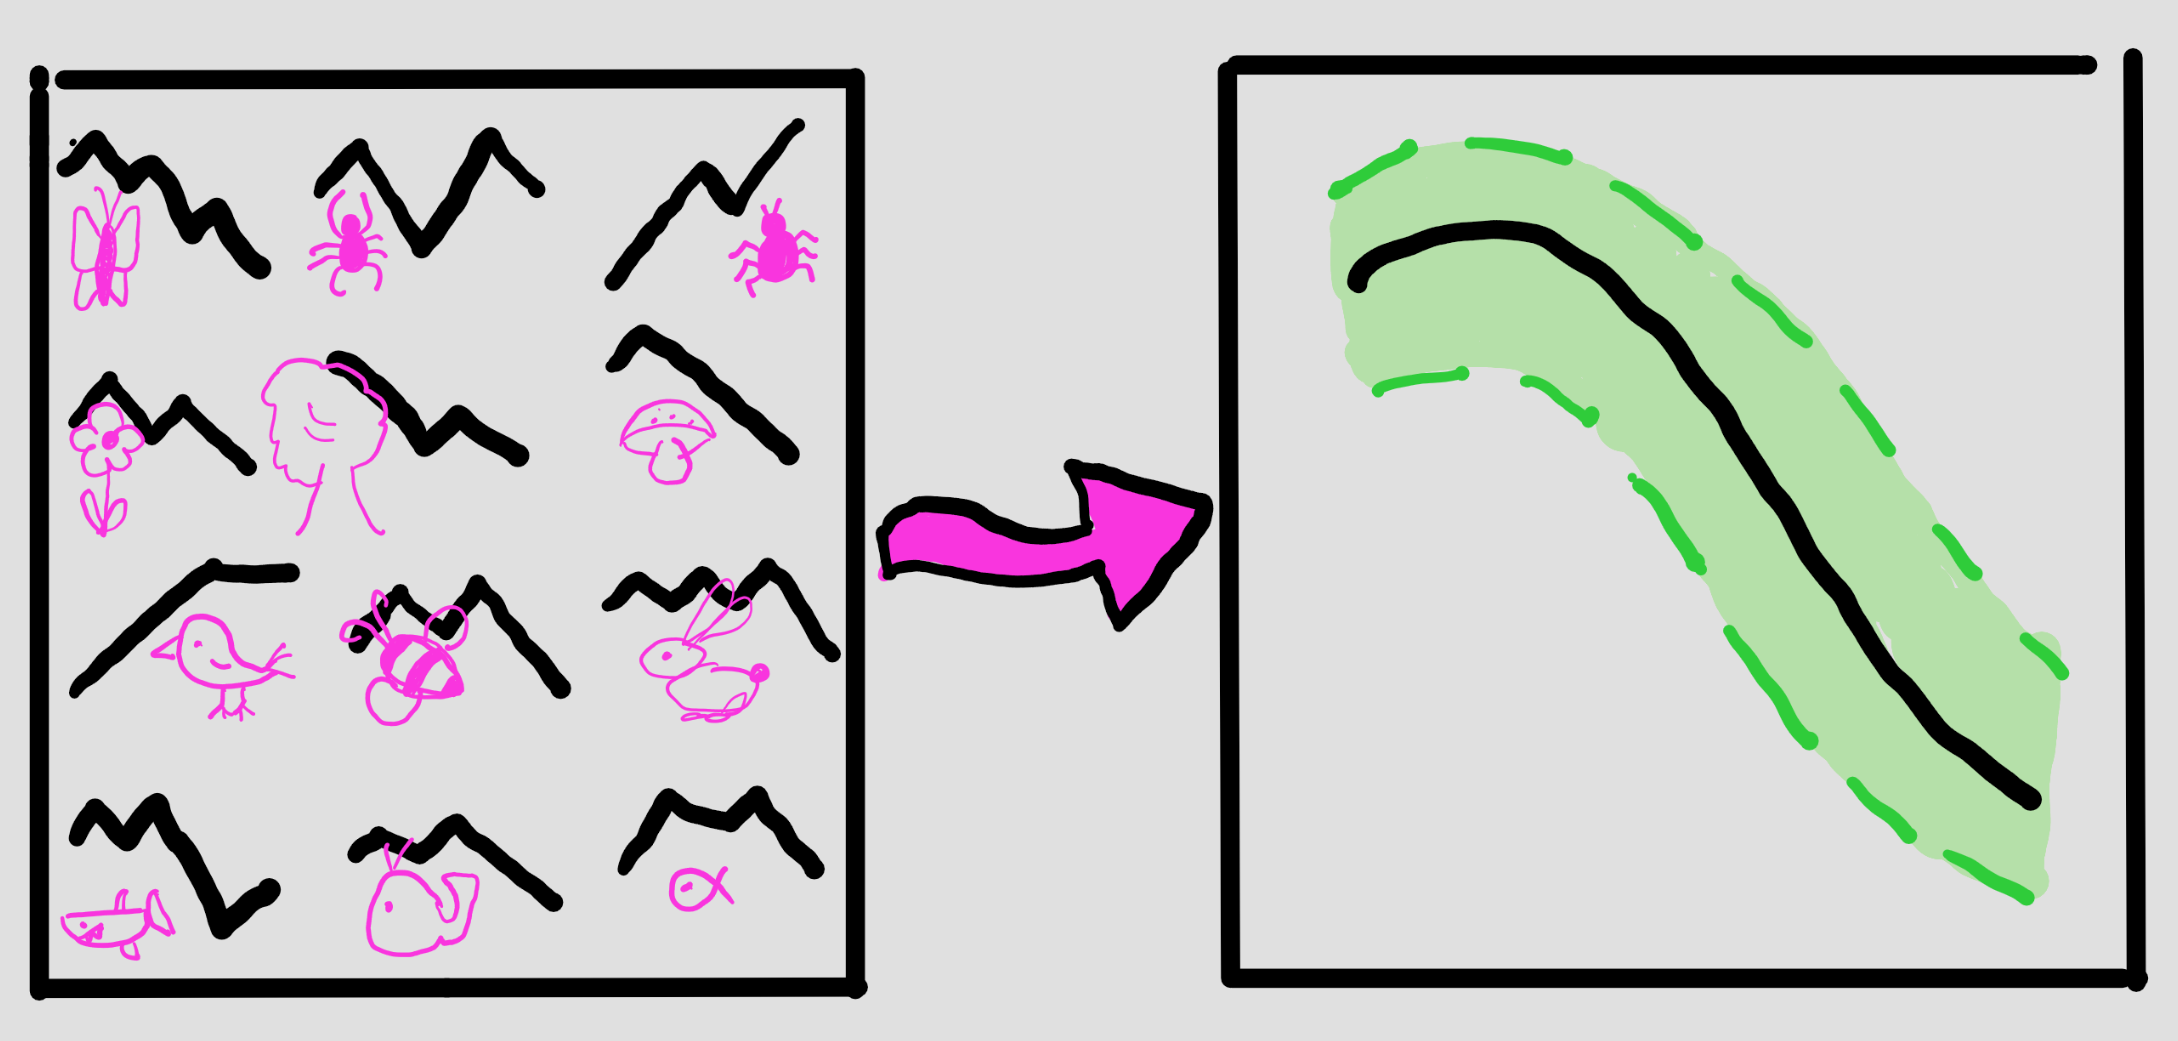
The method uses state-space models to combine time-varying indices of species status into a composite relative indicator for multiple taxa. Multispecies indicators can be challenging to produce because relative species abundance indices for different taxa are produced using very different methodologies, both in the field and in producing estimates for the species in those taxa. In addition, there are issues like missing data and varying temporal windows for different species. This method tries to overcome these issues, and some of its key features are:
-
Modelling individual year-to-year changes as latent variables, so there isn’t a requirement for data on every species in every year
-
The data from individual species indices are modelled on the scale of the linear predictor, so abundance data can take different forms (e.g. counts, biomass, presence / absence) for different species. (Though combining different linear predictors in one model is not recommended)
-
Different options for dealing with different aspects of uncertainty e.g., standard errors of individual species indices
-
The authors also provide implementations for model fitting using the Kalman filter, hidden Markov modelling, and Bayesian analysis
Motivations for developing this method and how it has been used
Mike also brought together Nick Isaac (UKCEH), one of the co-authors of the paper, and Clare Betts (Defra), who uses this method in the production of official statistics for biodiversity. Nick provided additional details on the motivations for developing this method:
-
There was quite a lot of variability in how existing biodiversity indicators were developed, involving several ad hoc decisions in the modelling – this method tries to bring those decisions into a common framework
-
There are substantial differences in data collection methods for different taxa, due to reasons relating to species biology and survey protocols – this method combines relative indices rather than the raw data to try and overcome this
Clare spoke about indicators from an official statistics perspective, having applied this method in the development of several biodiversity indicators for England and the UK. This includes the ‘all-species’ abundance indicator, which will be used to track government progress towards statutory targets of stopping species declines. Other indicators where this method has been used are:
-
Priority species abundance for England
-
Pollinator distribution for the UK
Clare’s team are interested in gathering feedback on the abundance indicators. In particular, they are seeking views on these big-picture aspects:
-
How well the indicator reflects overall species abundance in England
-
How the indicator is presented
-
The value of replicating the indicator at UK scale
And on more statistical issues:
-
Two versions with different degrees of smoothing (revealing long-term trend vs preserving short-term patterns) – which is more appropriate?
-
Accurately conveying uncertainty to users
-
Views on pre-smoothing individual indices before they are included in the indicator
-
How to explore model performance to aid interpretation
Discussion points
Questions and feedback from the group touched on some of these points:
-
How well does the indicator represent biodiversity?
-
Taxonomically – The number of taxa included in the indicator have increased over time (to around twice the number of species included at the start of the time series) as more reporting schemes have been developed. There is also a trade-off between greater taxonomic coverage and data quality to be considered.
-
Spatially – Some recording schemes have correction procedures for uneven sampling. Currently this indicator assumes the data included is representative of abundance across the area of concern, but this is an active area of discussion and developments in this area are expected over the coming years.
-
Each species has equal weight in the indicator. An alternative might be to weight some species more than others. However, weighting also involves a value judgement, e.g., should weighting be applied according to the species richness or abundance of the taxonomic class, or on how related species are to each other?
-
Rare species – Although species have equal weighting, extremely rare species could have stronger influence on this indicator, as small absolute changes in numbers will lead to large proportional changes, but using the geometric mean helps minimise this.
-
-
What exactly does a multispecies indicator need to capture? Having clear questions and requirements for the indicator would likely help resolve some uncertainties surrounding the development of the indicator (smoothing, weighting, etc)