October 2024 Workshop Summary: UK GHG Inventory- Improvements, Impact, Policy Implications
This month Dave Skirvin from ADAS led a session titled “UK GHG Inventory: Improvements, impact, policy implications. How much justification is needed to make a change”. He described the UK Greenhouse Gas (GHG) and Ammonia Emissions Inventory that was set-up to meet UK international agreements to understand, track and predict GHG emissions and estimate national stocks and flows of carbon and other gases. This is to help inform UK government on whether emission reduction targets are being met and to guide policy. The inventory has to comply with the IPCC principles of Transparency, Accuracy, Completeness, Compatibility and Consistency.
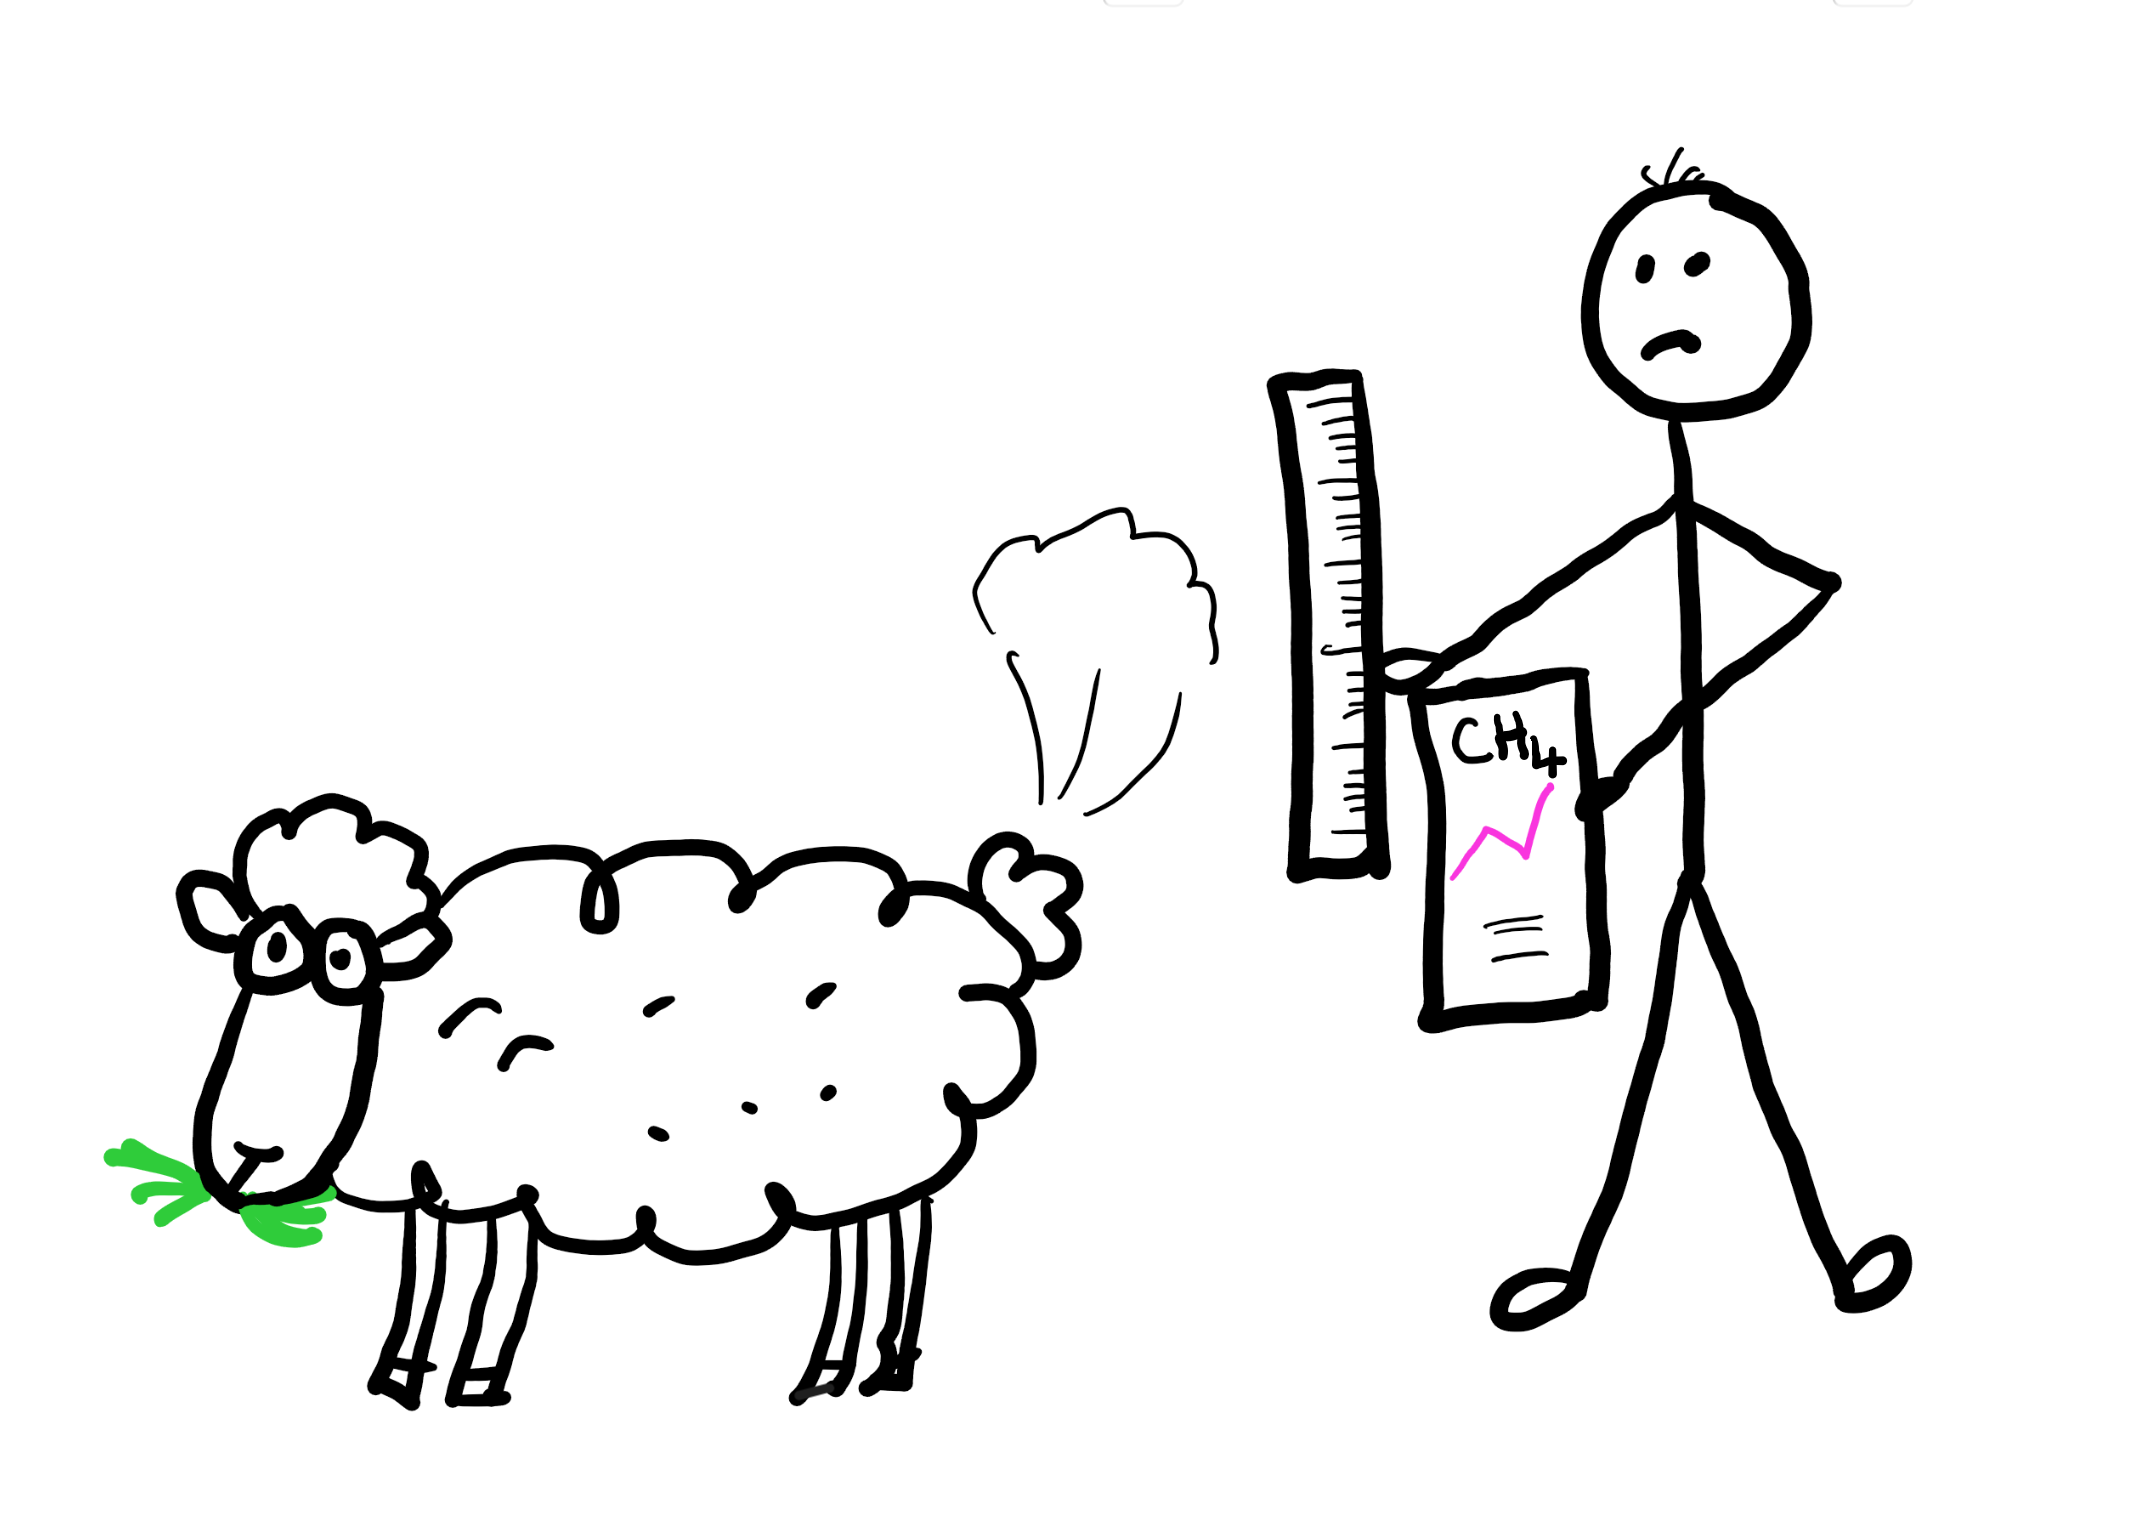
The inventory sits within DEFRA, with onward reporting to the Department for Energy Security and Net Zero and ADAS is the consortium lead for emissions within agriculture. They are responsible for emissions modelling in three sectors (sheep, arable, grassland) whilst Rothamsted (dairy, pigs, poultry and minor livestock) and Cranfield (beef) are responsible for other sectors. Ricardo is in charge of quality control for the agricultural inventory and its integration into the wider inventory.
All modelling is carried out on a 10km x 10km grid across the UK (soil types and climate are known for all of these grid squares), although not all input data is at this scale. Modelling is by sector and takes account of farm type, breed groups and system (eg hill, upland or lowland sheep farming). The calculation code can take up to 2-3 days to run all combinations of sector, year (1990 to current year minus 1) and country for the central tendency values of parameters. A full uncertainty analysis can take several weeks; each combination must be run for a minimum of 2000 replicate. Once the central tendency estimates, at devolved administration level, have been approved by DEFRA a full set of spatially explicit outputs are calculated for fine scale mapping by UKCEH and intergration with the ammonia deposition models.
The inventory – both data and code – can be updated either to correct errors or in response to new science. The model has to be rerun with the proposed change (including backcasting to 1990) and presented along with the implications and effect of the change to the Board.
Dave asked the group about advice on guidance in terms of how to assess whether new evidence should be included in the inventory and how to build a case to others that the change should be made. Specifically (1) how representative the evidence needs to be (2) how we judge if the evidence is robust (3) how we can demonstrate that we have correctly interpreted or incorporated that evidence into the inventory, especially when it is from multiple studies (4) do little changes to the inventory matter?
Key points that came out of the discussion were:
-
Needing to find a way to capture the scale and uncertainty of the change, including sensitivity analyses
-
Consider showing/modelling the range of values (envelope) within which outputs could fall to make it easier to observe how new outputs compare
-
Consider how to model the uncertainties in assumptions as well as in the data and models
-
Whether official Statistics protocols would be useful to apply here. It was noted that to be an Official Statistic, the producer must be on the Parliamentary Order for Official Statistics, but anyone can follow the Code of Practise for Statistics